MILK, YOGHURT, CHEESE AND ALTERNATIVES
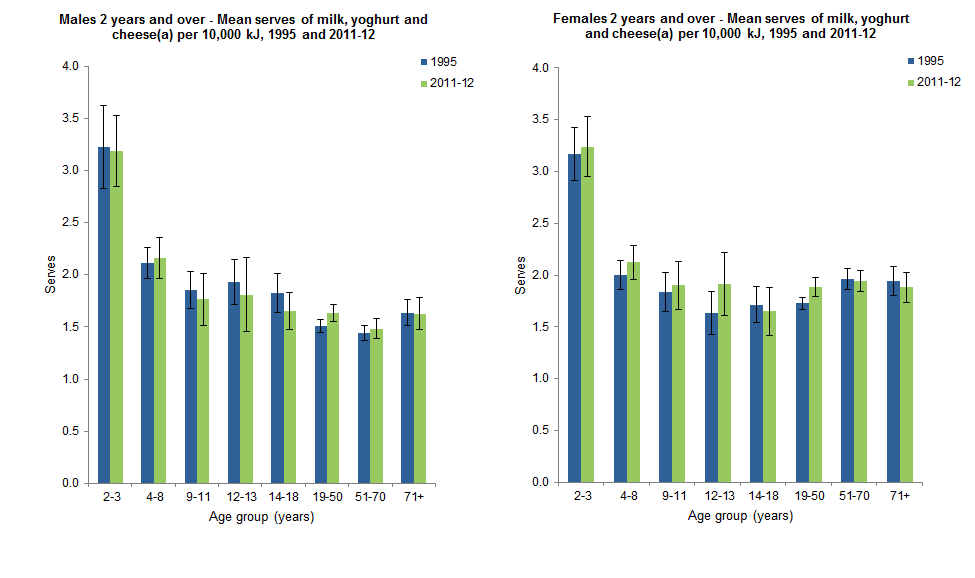
Overall consumption of milk, yoghurt, cheese and alternatives was similar in 2011-12 and 1995 with an average 1.8 serves per 10,000 kJ. Both males and females aged 19-50 years had small but significant increases of 0.1 and 0.2 serves per 10k kJ over the period respectively.

(a) From non-discretionary sources, Based on Day 1. See Glossary for definition.
Sources: National Nutrition and Physical Activity Survey, 2011-12 and National Nutrition Survey, 1995
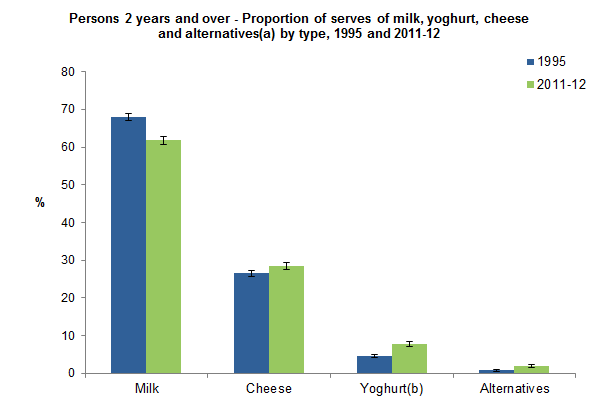
Dairy milk made up the majority of the group in each period, although the contribution in 2011-12 (62%), was down on 1995 (68%) due to a 7% decline in milk consumption coupled with a 12% increase in cheese and a 71% increase in yoghurt consumption over the period.
While yoghurt’s overall share of the milk, yoghurt, cheese and alternatives group in 2011-12 was minor at 7.8%, this was an increase on the 4.6% share in 1995. “Alternatives” such as soy milk also gained in share from 0.8% in 1995 to 1.9% of the total group in 2011-12.

(a) From non-discretionary sources, Based on Day 1. See Glossary for definition.
(b) Includes custard and dairy snacks such as fromage frais.
Sources: National Nutrition and Physical Activity Survey, 2011-12 and National Nutrition Survey, 1995
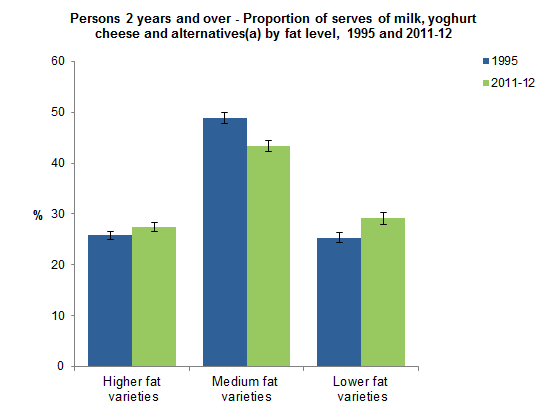
Based on the 2013 ADG, all foods within the milk, yoghurt, cheese and alternatives food group were classified as belonging to either ‘high fat’, ‘medium fat’ or ‘lower fat’ categories.1 While ‘medium fat’ foods remained the greatest contributor, between 1995 and 2011-12, consumption of the ‘medium fat’ group declined from 49% to 43%, while ‘lower fat’ increased from 25% to 29%. This shift is associated with the trend over the period for consumers to increasingly opt for reduced fat milk, which increased as a proportion of dairy milk from 32% to 39% over the period. The increase in yoghurt consumption tended to have little influence on the profile of fat consumption because around half the serves were lower fat and half were medium fat. Cheese, on the other hand was virtually all classified as higher fat so the increase in cheese consumption drove a small increase in the proportion of the higher fat varieties (from 25% to 29%).

(a) From non-discretionary sources, Based on Day 1. See Glossary for definition.
Sources: National Nutrition and Physical Activity Survey, 2011-12 and National Nutrition Survey, 1995
Discretionary sources of milk, yoghurt, cheese and alternatives
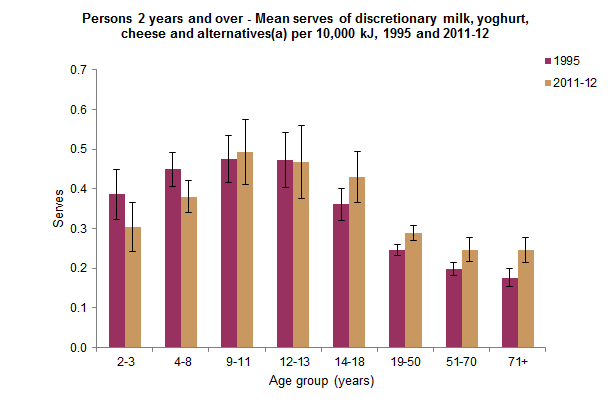
The ADG recommendations of food sources for milk, yoghurt, cheese and alternatives group excludes food sources defined as discretionary. However, if such foods were counted (e.g. as ingredients in discretionary foods), they would add an extra 0.3 serves per 10,000 kJ (or 16-17%) in each period.
Consumption of dairy-based discretionary foods was highest among children and adolescents in both periods but the pattern differed slightly. In 1995, children aged 2-3 and 4-8 years had a greater consumption of dairy-based discretionary foods than their 2011-12 counterparts (associated with higher ice cream consumption in 1995) while in 2011-12 people aged 14-18 years, 19-50 year and 51-70 years consumed more dairy-based discretionary serves due to greater consumption of discretionary pizza.2

(a) From discretionary sources. Based on Day 1. See Glossary for definition.
Sources: National Nutrition and Physical Activity Survey, 2011-12 and National Nutrition Survey, 1995
ENDNOTES
1. Lower fat products include reduced fat and skim milk, and yoghurt with less than 4g/100 g of fat. Higher fat dairy products include cheese and yoghurt with a fat content of greater than 10g/100 g. Medium fat products include cheese and yoghurt with a fat content between 4g and 10 g per 100 g. This group also includes regular fat milk, which although mostly has a fat level less than 4 g per 100 g, was included in medium fat to be consistent with the ADG modelling and recommendations. See AHS ADG Classification system Explanatory Notes.
2. Mixed dishes with saturated fat content greater than 5% were classified as ‘discretionary’. See AHS Users’ Guide for more information.
 Print Page
 Print All